Daily price returns (in pence) of Abbey National shares between 7/31/91 and 10/8/91
Source:R/BSDA-package.R
Abbey.RdData used in problem 6.39
AbbeyFormat
A data frame/tibble with 50 observations on one variable
- price
daily price returns (in pence) of Abbey National shares
Source
Buckle, D. (1995), Bayesian Inference for Stable Distributions, Journal of the American Statistical Association, 90, 605-613.
References
Kitchens, L. J. (2003) Basic Statistics and Data Analysis. Pacific Grove, CA: Brooks/Cole, a division of Thomson Learning.
Examples
qqnorm(Abbey$price)
qqline(Abbey$price)
 t.test(Abbey$price, mu = 300)
#>
#> One Sample t-test
#>
#> data: Abbey$price
#> t = -0.050454, df = 49, p-value = 0.96
#> alternative hypothesis: true mean is not equal to 300
#> 95 percent confidence interval:
#> 298.3668 301.5532
#> sample estimates:
#> mean of x
#> 299.96
#>
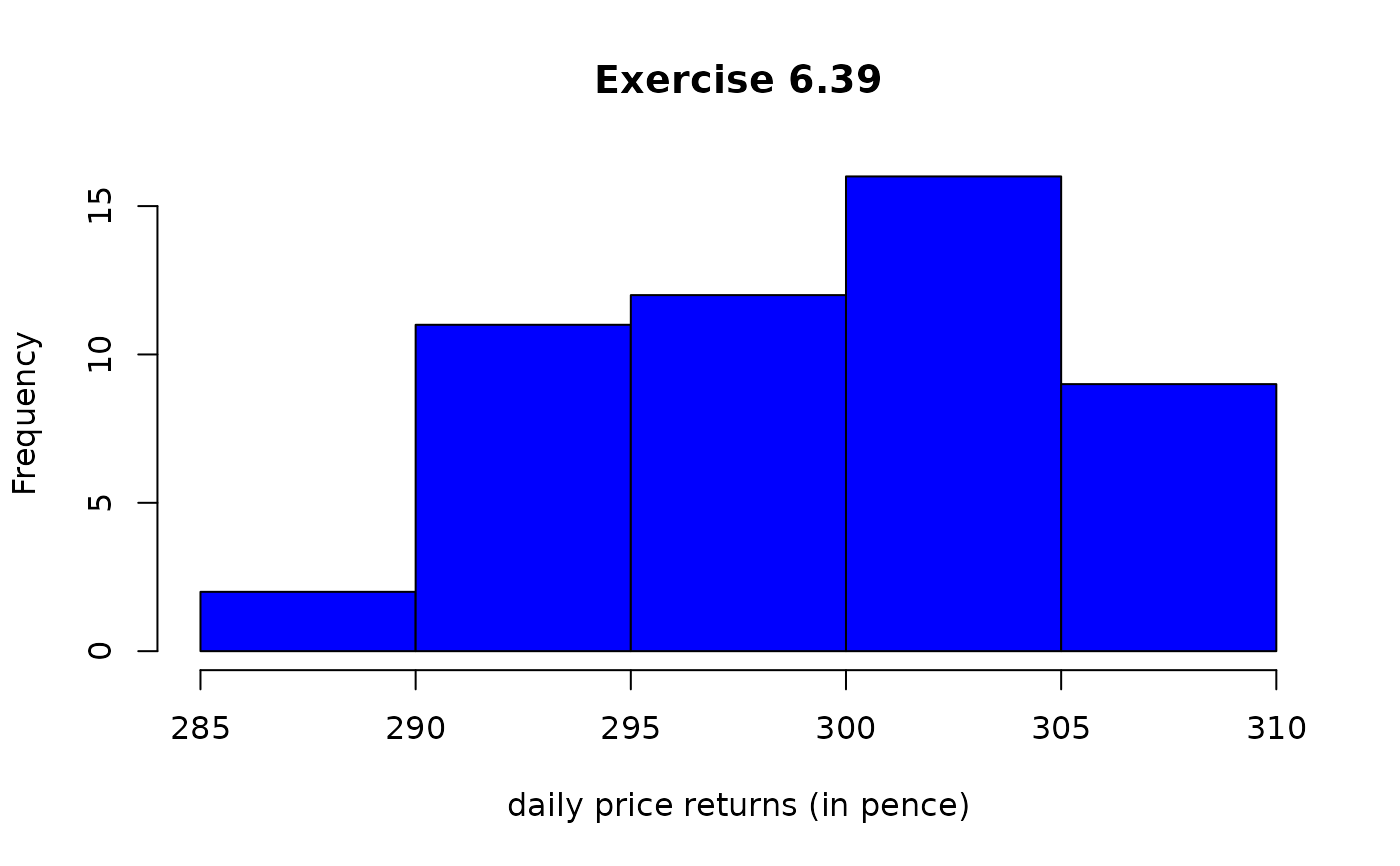
hist(Abbey$price, main = "Exercise 6.39",
xlab = "daily price returns (in pence)",
col = "blue")
t.test(Abbey$price, mu = 300)
#>
#> One Sample t-test
#>
#> data: Abbey$price
#> t = -0.050454, df = 49, p-value = 0.96
#> alternative hypothesis: true mean is not equal to 300
#> 95 percent confidence interval:
#> 298.3668 301.5532
#> sample estimates:
#> mean of x
#> 299.96
#>
hist(Abbey$price, main = "Exercise 6.39",
xlab = "daily price returns (in pence)",
col = "blue")