To test a single proportion using the infer package, we will use the gss (General Social Survey) dataset. In this example, we will test whether the proportion of college graduates in the population is equal to 30%.
The process follows the four main verbs of the infer pipeline: specify(), hypothesize(), generate(), and calculate().
The Hypothesis Test
Null Hypothesis (\(H_0: p = 0.30\)) The proportion of college graduates is \(0.30\).
Alternative Hypothesis (\(H_A: p \neq 0.30\)): The proportion of college graduates is not \(0.30\).
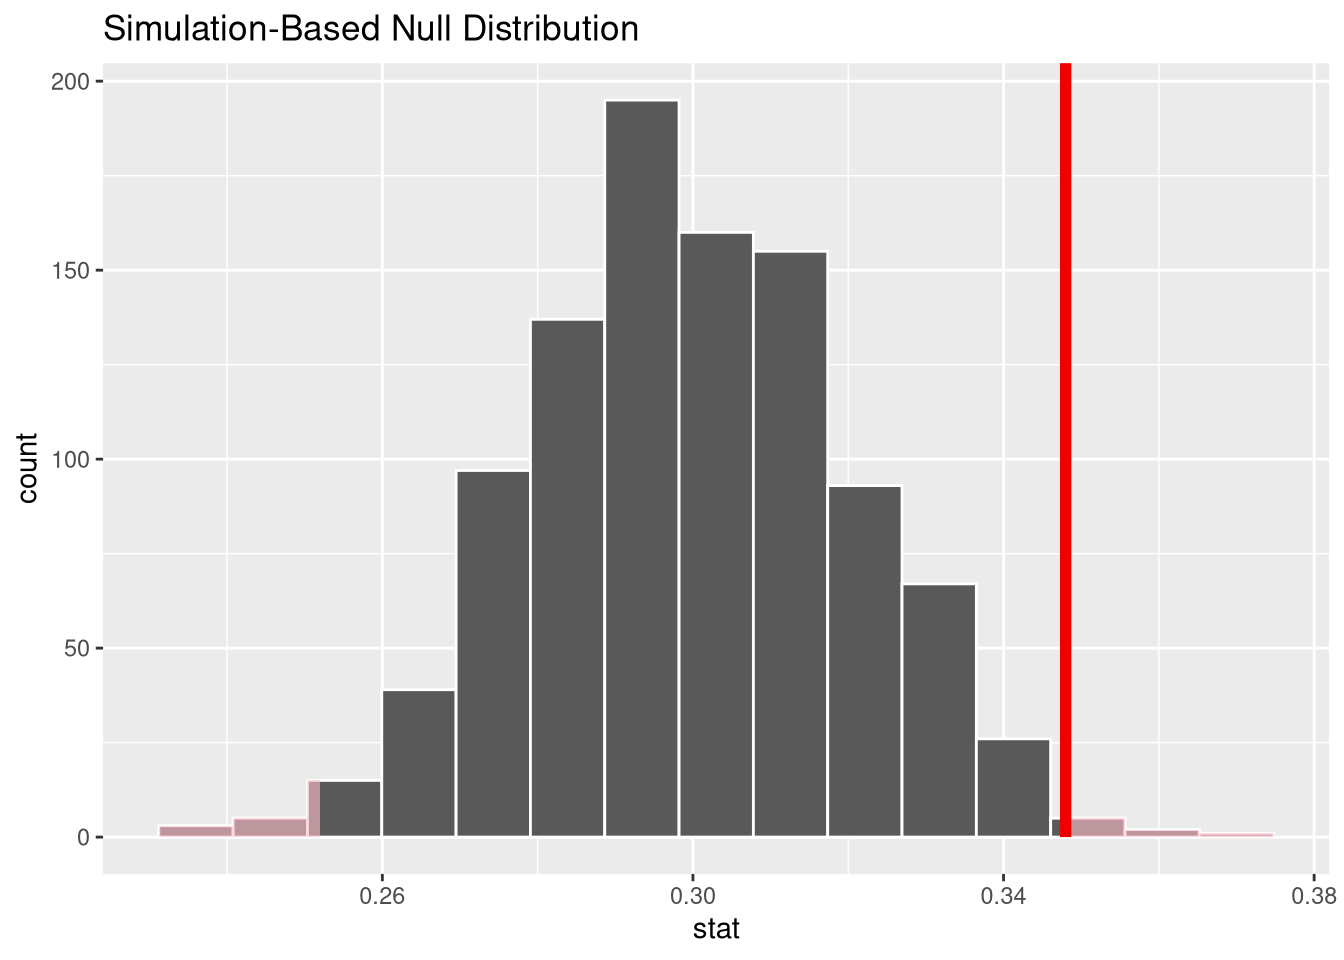
library(infer)library(dplyr)# 1. Calculate the observed statistic from the dataobs_stat <- gss |>specify(response = college, success ="degree") |>calculate(stat ="prop")# 2. Generate the null distributionnull_distribution <- gss |>specify(response = college, success ="degree") |>hypothesize(null ="point", p =0.30) |>generate(reps =1000, type ="draw") |>calculate(stat ="prop")# 3. Visualize the resultsnull_distribution |>visualize() +shade_p_value(obs_stat = obs_stat, direction ="two-sided")
# 4. Get the p-valuenull_distribution |>get_p_value(obs_stat = obs_stat, direction ="two-sided")
# A tibble: 1 × 1
  p_value
    <dbl>
1   0.016
A Note on type = "draw" In the infer documentation, type = "draw" is used for point estimates of a single proportion. This method samples from a theoretical distribution (like a binomial) based on the \(p\) value you specified in hypothesize().